
Steven and Roberta Denning Professor of Finance
Senior Fellow, Hoover Institution
Senior Fellow, Stanford Institute for Economic Policy Research
Recent Research
(with G Buchak, G Matvos and T Piskorski), 2024
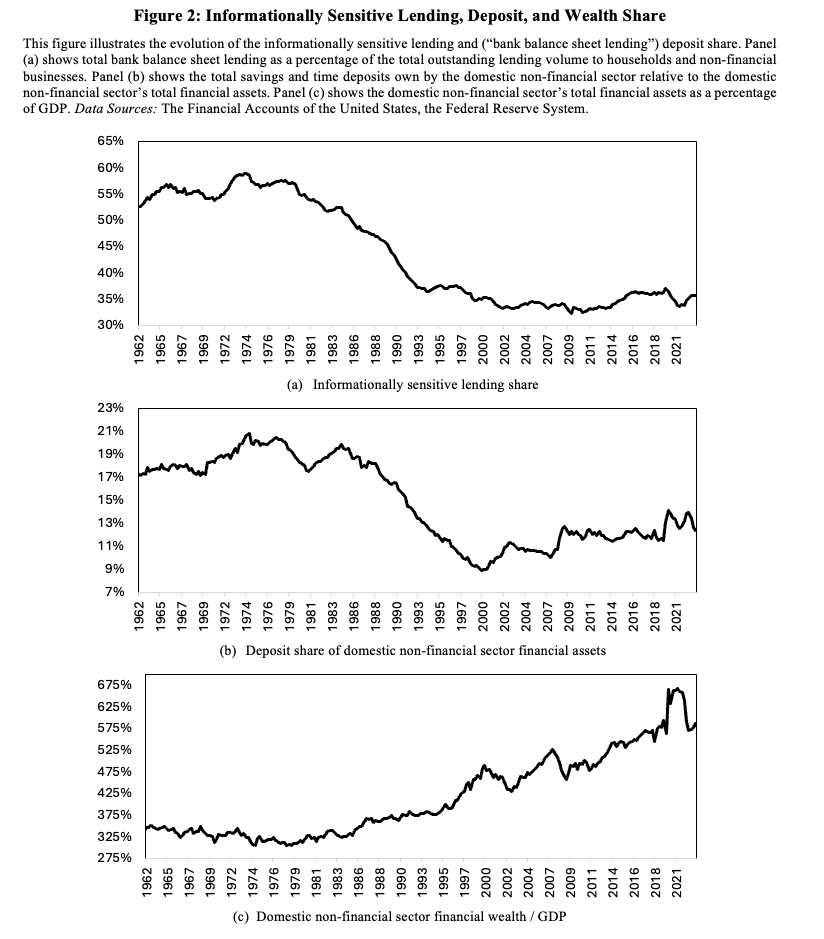
The traditional model of bank-led financial intermediation, where banks issue demandable deposits to savers and make informationally sensitive loans to borrowers, has seen a dramatic decline since 1970s. Instead, private credit is increasingly intermediated through arms-length transactions, such as securitization. This paper documents these trends, explores their causes, and discusses their implications for the financial system and regulation. We document that the balance sheet share of overall private lending has declined from 60% in 1970 to 35% in 2023, while the deposit share of savings has declined from 22% to 13%. Additionally, the share of loans as a percentage of bank assets has fallen from 70% to 55%. We develop a structural model to explore whether technological improvements in securitization, shifts in saver preferences away from deposits, and changes in implicit subsidies and costs of bank activities can explain these shifts. Declines in securitization cost account for changes in aggregate lending quantities. Savers, rather than borrowers, are the main drivers of bank balance sheet size. Implicit banks’ costs and subsidies explain shifting bank balance sheet composition. Together, these forces explain the fall in the overall share of informationally sensitive bank lending in credit intermediation. We conclude by examining how these shifts impact the financial sector’s sensitivity to macroprudential regulation. While raising capital requirements or liquidity requirements decreases lending in both early (1960s) and recent (2020’s) scenarios, the effect is less pronounced in the later period due to the reduced role of bank balance sheets in credit intermediation. The substitution of bank balance sheet loans with debt securities in response to these policies explains why we observe only a fairly modest decline in aggregate lending despite a large contraction of bank balance sheet lending. Overall, we find that the intermediation sector has undergone significant transformation, with implications for macroprudential policy and financial regulation.
(with DeMarzo, Jiang, Krishnamurthy, Matvos and Piskorski), 2023
Summary
- New economic conditions have led to insolvency concerns across the banking system.
- There are too many banks in this situation to resolve with one-off solutions.
- Government backstops and regulatory forbearance risk a repeat of the S&L crisis.
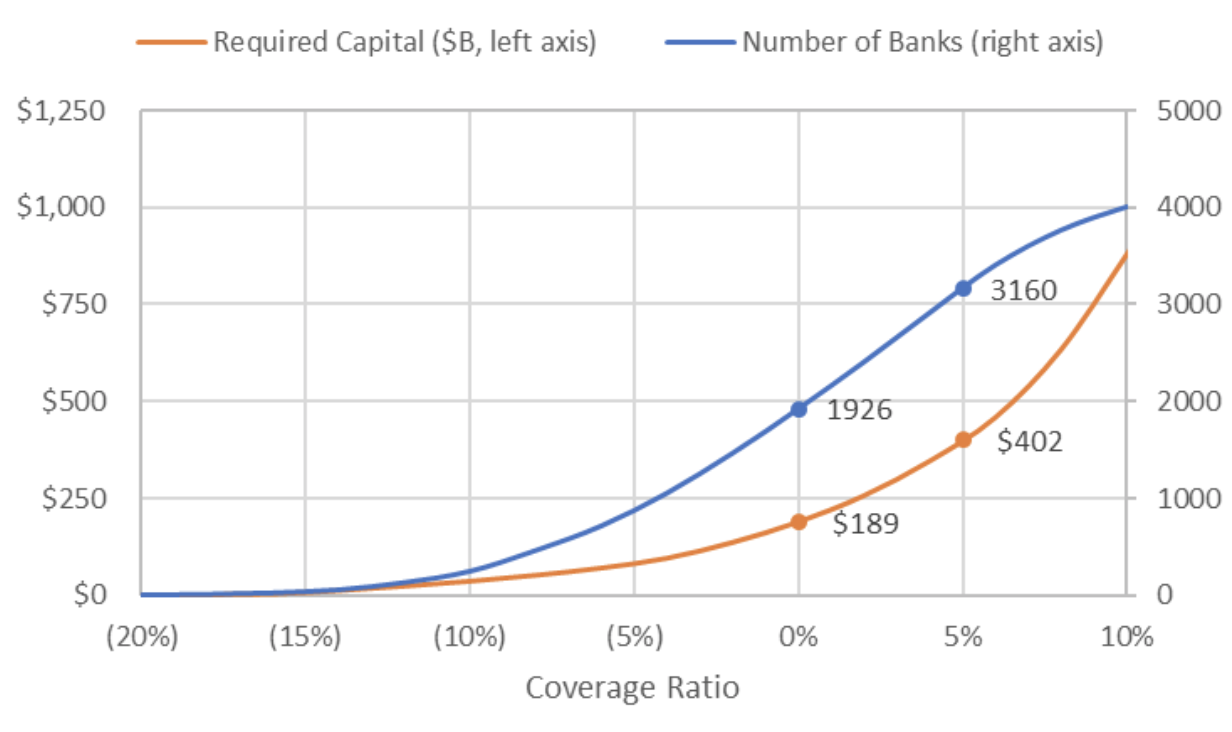
- Requiring banks to promptly raise equity capital will both reduce fragility and provide a needed market test to identify truly insolvent banks.
- The amount of private capital needed is in the range of $190 to $400 billion.
(with E Jiang, G Matvos and T Piskorski), 2023
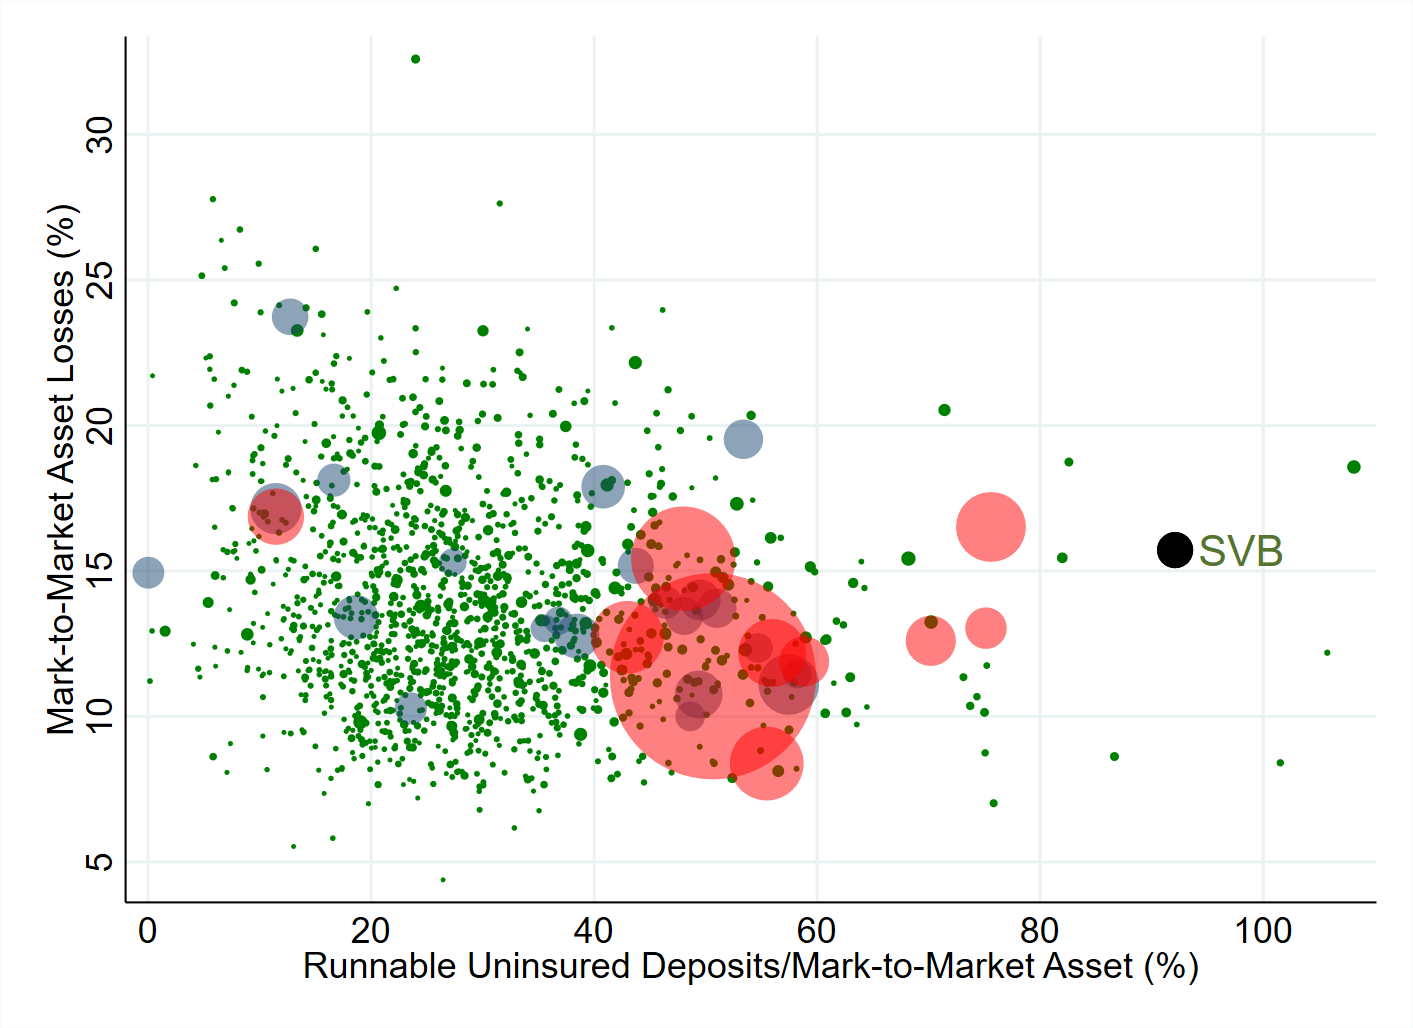
We analyze U.S. banks’ asset exposure to a recent rise in the interest rates with implications for financial stability. The U.S. banking system’s market value of assets is $2.2 trillion lower than suggested by their book value of assets accounting for loan portfolios held to maturity. Marked-to-market bank assets have declined by an average of 10% across all the banks, with the bottom 5th percentile experiencing a decline of 20%. Most of these asset declines were not hedged by banks with use of interest rate derivatives. We illustrate in a simple model that uninsured leverage (i.e., Uninsured Debt/Assets) is the key to understanding whether these losses would lead to some banks in the U.S. becoming insolvent– unlike insured depositors, uninsured depositors stand to lose a part of their deposits if the bank fails, potentially giving them incentives to run. We show that a bank’s survival depends on the market beliefs about the share of uninsured depositors who will withdraw money following a decline in the market value of bank assets. If interest rate increases are small such that the bank’s decline in asset values is relatively small, there is no risk of a run equilibrium. However, for sufficiently high increases in interest rates, we have multiple equilibria in which uninsured depositor run making banks insolvent (i.e., a “bad” run equilibrium) becomes a possibility. Banks with smaller initial capitalization and higher uninsured leverage have a smaller range of beliefs supporting a “good” no run equilibrium, increasing their fragility to uninsured depositor runs. A case study of the recently failed Silicon Valley Bank (SVB) is illustrative. 10 percent of banks have larger unrecognized losses than those at SVB. Nor was SVB the worst capitalized bank, with 10 percent of banks having lower capitalization than SVB. On the other hand, SVB had a disproportional share of uninsured funding: only 1 percent of banks had higher uninsured leverage. Combined, losses and uninsured leverage provide incentives for an SVB uninsured depositor run. We compute similar incentives for the sample of all U.S. banks. Even if only half of uninsured depositors decide to withdraw, almost 190 banks with assets of $300 billion are at a potential risk of impairment, meaning that the mark-to-market value of their remaining assets after these withdrawals will be insufficient to repay all insured deposits. If uninsured deposit withdrawals cause even small fire sales, substantially more banks are at risk. Regions with lower household incomes and large shares of minorities are more exposed to the bank risk. We also show that decline in banks’ asset values eroded the ability of banks to withstand adverse credit events – focusing on commercial real estate loans. Overall, these calculations suggest that recent declines in bank asset values very significantly increased the fragility of the US banking system to uninsured depositor runs.
(with E Jiang, G Matvos and T Piskorski), 2023
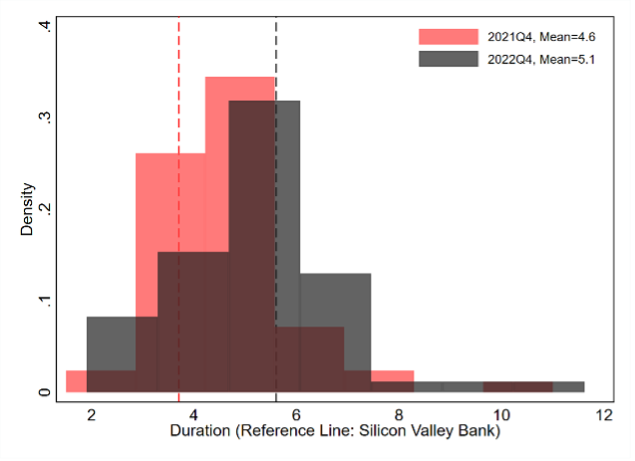
We analyze the extent to which U.S. banks hedged their asset exposure as the monetary policy tightened in 2022. We use call reports data for interest rate swaps covering close to 95% of all bank assets and supplement it with hand-collected data on broader hedging activity from 10K and 10Q filings for all publicly traded banks (68% of all bank assets). Interest rate swap use is concentrated among larger banks who hedge a small amount of their assets. Over three quarters of all reporting banks report no material use of interest rate swaps. Swap users represent about three quarters of all bank assets, but on average hedge only 4% of their assets and about one quarter of their securities. Only 6% of aggregate assets in the U.S. banking system are hedged by interest rate swaps. We also find limited hedging of interest rate exposure by publicly traded banks and by banks which report the duration of their assets. The use of hedging and other interest rate derivatives was not large enough to offset a significant share of the $2.2 trillion loss in the value of U.S. banks’ assets (Jiang et al. 2023). The duration of bank assets increased during 2022, exposing banks to additional interest rate risk. We find slightly less hedging for banks whose assets were most exposed to interest rate risk. Banks with the most fragile funding – i.e., those with highest uninsured leverage — sold or reduced their hedges during the monetary tightening. This allowed them to record accounting profits but exposed them to further rate increases. These actions are reminiscent of classic gambling for resurrection: if interest rates had decreased, equity would have reaped the profits, but if rates increased, then debtors and the FDIC would absorb the losses.
(with E Jiang, G Matvos and T Piskorski), 2023
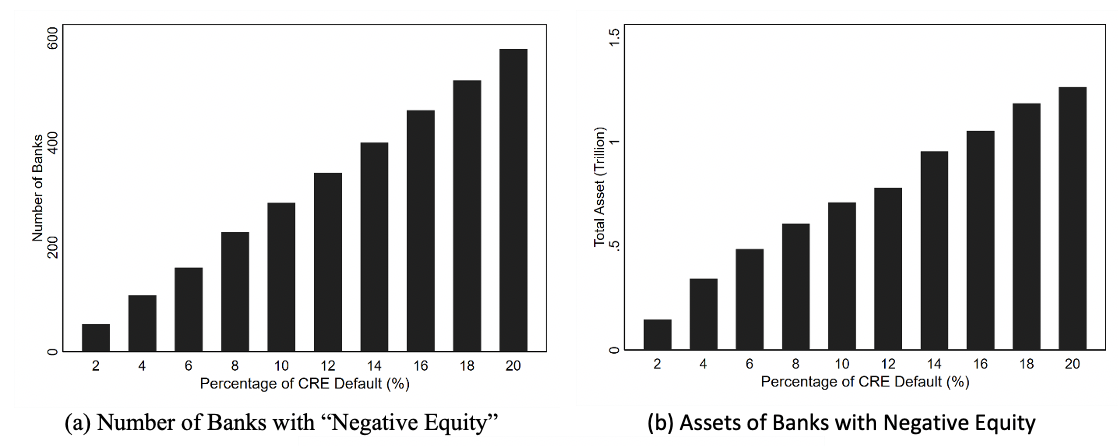
Jiang et al. (2023) find that following recent monetary tightening the U.S. banking system’s market value of assets is $2.2 trillion lower than suggested by their book value, accounting for loan portfolios held to maturity. We illustrate that this decline in banks’ asset values has eroded their ability to withstand adverse credit events – focusing on commercial real estate (CRE) loans that account for about quarter of assets for an average bank ($2.7 trillion of bank assets in the aggregate). A 10% (20%) default rate on CRE loans – a range close to what one saw in the Great Recession on the lower end — would result in about $80 ($160) billion of additional bank losses. While these losses are an order of magnitude smaller than the decline in bank asset values associated with a recent rise of interest rates, they do impact a non-trivial set of banks: an additional 280 (579) banks with aggregate assets of $700 billion ($1.2 trillion) would have their marked to market value of assets below the face value of all their non-equity liabilities. We again focus on uninsured leverage (i.e., Uninsured Debt/Assets) as the key to understanding whether these losses would lead to some banks in the U.S. becoming potentially insolvent–unlike insured depositors, uninsured depositors stand to lose a part of their deposits if the bank fails, potentially giving them incentives to run. Even if only half of uninsured depositors decide to withdraw, the losses due to CRE distress would result in additional 21 (58) smaller regional banks at a potential risk of impairment to insured depositors.

(with G Buchak, G Matvos and T Piskorski), 2022 (R&R, Journal of Political Economy)
We study the frictions in dealer-intermediation in residential real estate through the lens of “iBuyers,” technology entrants, who purchase and sell residential real estate through online platforms. iBuyers supply liquidity to households by allowing them to avoid a lengthy sale process. They sell houses quickly and earn a 5% spread. Their prices are well explained by a simple hedonic model, consistent with their use of algorithmic pricing. iBuyers choose to intermediate in markets that are liquid and in which automated valuation models have low pricing error. These facts suggest that iBuyers’ speedy offers come at the cost of information loss concerning house attributes that are difficult to capture in an algorithm, resulting in adverse selection. We calibrate a dynamic structural search model with adverse selection to understand the economic forces underlying the tradeoffs of dealer intermediation in this market. The model reveals the central tradeoff to intermediating in residential real estate. To provide valuable liquidity service, transactions must be closed quickly. Yet, the intermediary must also be able to price houses precisely to avoid adverse selection, which is difficult to accomplish quickly. Low underlying liquidity exacerbates adverse selection. Our analysis suggests that iBuyers’ technology provides a middle ground: they can transact quickly limiting information loss. Even with this technology, intermediation is only profitable in the most liquid and easy to value houses. Therefore, iBuyers’ technology allows them to supply liquidity, but only in pockets where it is least valuable. We also find limited scope for dealer intermediation even with improved pricing technology, suggesting that underlying liquidity will be an impediment for intermediation in the future.

(with E Jiang, G Matvos and T Piskorski), 2022
Is bank capital structure designed to extract deposit subsidies? We address this question by studying capital structure decisions of shadow banks: intermediaries that provide banking services but are not funded by deposits. We assemble, for the first time, call report data for shadow banks which originate one quarter of all US household debt. We document five facts.
(1) Shadow banks use twice as much equity capital as equivalent banks, but are substantially more leveraged than non-financial firms.
(2) Leverage across shadow banks is substantially more dispersed than leverage across banks.
(3) Like banks, shadow banks finance themselves primarily with short-term debt and originate long-term loans. However, shadow bank debt is provided primarily by informed and concentrated lenders.
(4) Shadow bank leverage increases substantially with size, and the capitalization of the largest shadow banks is similar to banks of comparable size.
(5) Uninsured leverage, defined as uninsured debt funding to assets, increases with size and average interest rates on uninsured debt decline with size for both banks and shadow banks.
Modern shadow bank capital structure choices resemble those of pre-deposit-insurance banks both in the U.S. and Germany, suggesting that the differences in capital structure with modern banks are likely due to banks’ ability to access insured deposits. Our results suggest that banks’ level of capitalization is pinned down by deposit subsidies and capital regulation at the margin, with small banks likely to be largest recipients of deposit subsidies. Models of financial intermediary capital structure then have to simultaneously explain high (uninsured) leverage, which increases with the size of the intermediary, and allow for substantial heterogeneity across capital structures of firms engaged in similar activities. Such models also need to explain high reliance on short-term debt of financial intermediaries.
Selected Data
Financial Advisor Misconduct Statistics based on The Market for Financial Market Misconduct
by Egan, Matvos and Seru,
Journal of Political Economy, 2018.
[Data here]